Dashboard
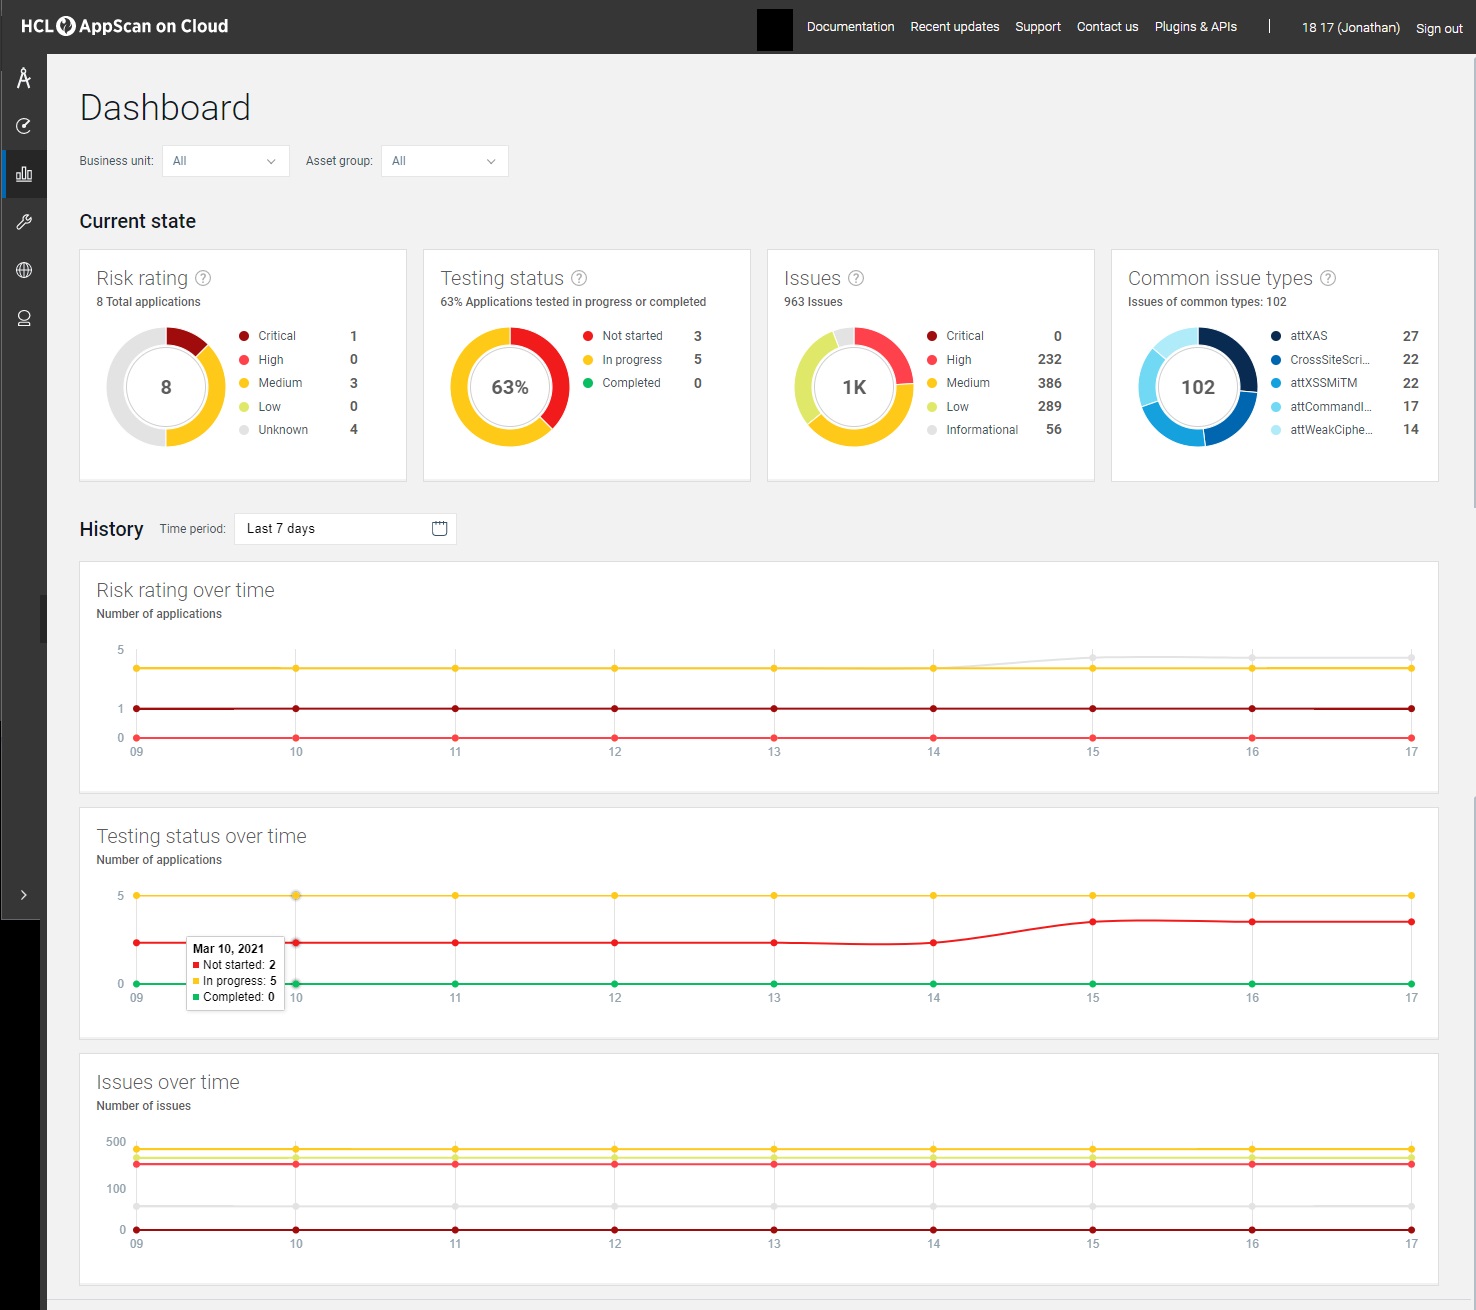
The main dashboard is the third item on the main menu bar. It gives you a detailed overview of the current state and history of all your applications.
When opened, data is shown for all applications in the default asset group. To filter by business unit and/or asset group, select options from the two drop-down filters at the top of the page.
Current state
The current state of all your applications is summarized graphically in four pie charts.
| Chart | Description |
|---|---|
| Risk rating | Shows the proportions and numbers of applications
in the portfolio with each type of risk rating: Critical,
High, Medium, Low, and
Unknown. The risk rating is calculated based on the business impact of the application, and the severity of issues found in scans. For more details, see Risk rating. The central counter shows the total number of applications in the portfolio for this user. |
| Testing status | Shows the proportions and numbers of applications with
status: Not started, In progress,
Completed. The central counter shows the percentage of scans currently In progress. |
| Issues | Shows the proportions and number of active
issues, meaning issues whose status is New (deprecated),
Open, In Progress, or
Reopened. Issues whose status is Closed or Noise are ignored. The central counter shows the total number of issues with severity of Critical, High, Medium, and Low only. |
| Common issue types | Shows the five most common issue types across all
applications in your portfolio, that are both:
The central counter shows the total number of issues in this portfolio that belong to these five types. |
History
- From the Time period drop-down list you can select one of the set periods, or define start and end dates for the graphs.
| Graph | Description |
|---|---|
| Risk rating over time | Shows the number of applications with each type of risk rating, for all dates in the selected range. See Risk rating. |
| Testing status over time | Shows the number of applications with status Not started, In progress, and Completed, for all dates in the selected range. |
| Issues over time | Shows the total number of each level of issue severity, across all your applications. |