Evaluating response time results
When you initiate a test run from the test workbench, the Mobile and Web UI Statistical report displays graphs in the Step Performance view by default. This graph shows the average response time for each test step. However, there is an option which, when enabled, will collect data on the response time within the application and outside the application (in the network and server) for each selected step. With this additional data, you can identify the contribution of the application against the contribution of the network and server to an unexpected response time or breakdown for a test step.
Before you begin
About this task
Procedure
- Click Run Test in the test workbench.
-
In the Run Configuration wizard, in the Performance
Measurement page, click Next, and select Collect
Response Time Contribution Data. When the test is completed, the Mobile and Web UI
Statistical Report displays graphs that represent the response time for each step in the test. By
default, only the 10 highest response times are collected during playback, but the filter can be
changed as follows:
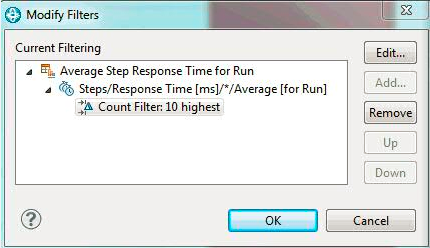
- Right-click anywhere on the Step performance report, and select Modify Filters in the context menu. In Modify Filters, select Count Filter: 10 highest (see figure 1) and click Edit.
- In the Performance Counter Filter wizard, select Filter by count. You can enter a new value in Number to Display, and select Show highest values or Show lowest values. For example, if you enter 15, the report will show the 15 highest response times or the 15 response times with the lowest values.
Figure 1: Modify Filters
-
Right-click any response time graph and, from the pop-up
menu, select Display Step Response Time Contributions (see
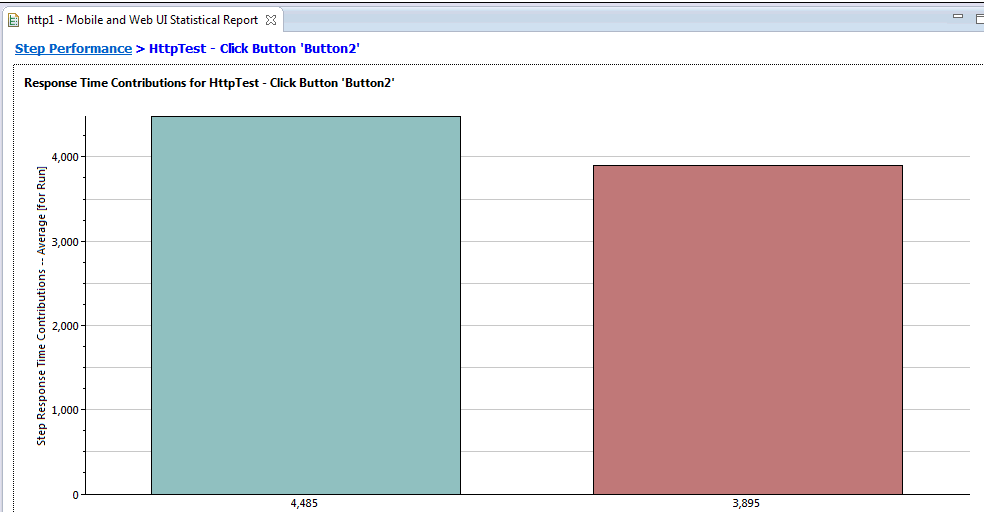
figure 2). A graph displays the time spent in the application On
App Time, and another graph displays the time spent outside
the application (in the network and server) Off App Time (see
figure 3). If you do not select Collect Response Time Contribution
Data when you run the test, no response time contribution
data is collected for the steps in the test, and the Display
Step Response Time Contributions option is unavailable.
Response time is also measured for the first step, that is, the start step.Restriction: Off App Time is not measured for the start step of Web and Hybrid applications, for Android versions prior to 4.0.
Figure 2: Response time contribution bar graphs for the 10 highest steps of the test
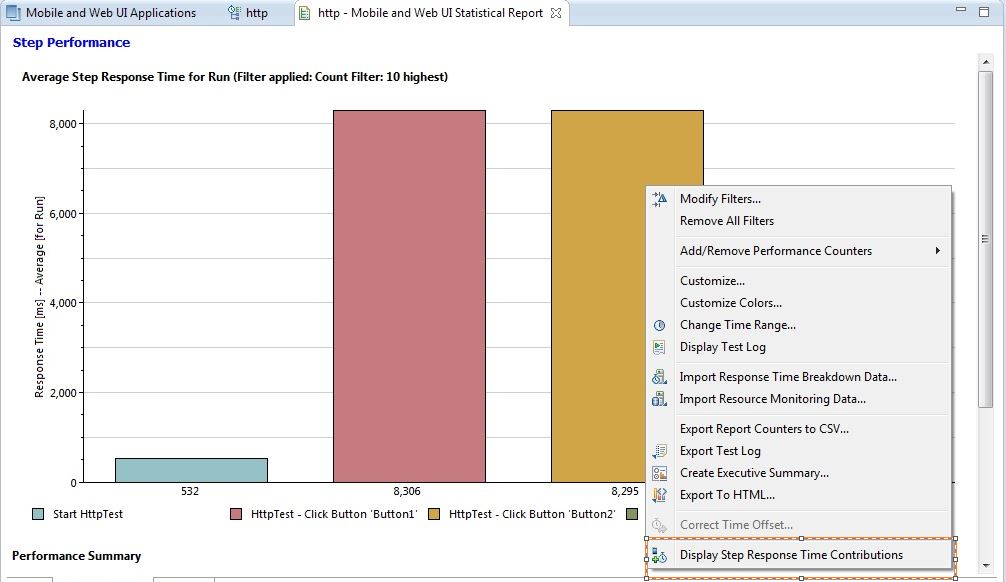
Figure 3: On App and Off App Time for one selected step
- Click the Step Performance link at the beginning of the Step Performance tab to return to the main page.