Using Sanity to monitor Component Pack
Sanity provides a dashboard where you can monitor the health of all applications running within IBM Connections™ Component Pack.
The sanity solution consists of two services:
- Sanity: provides a dashboard where you can monitor the health of all applications running within IBM Connections™ Component Pack.
- Sanity-watcher: monitors the helm list of installed releases and upgrades sanity with the latest list of services to monitor when it detects any helm release has been added or removed.
What does Sanity do?
Each service running in Component Pack can be resolved, and Sanity performs the following verifications:
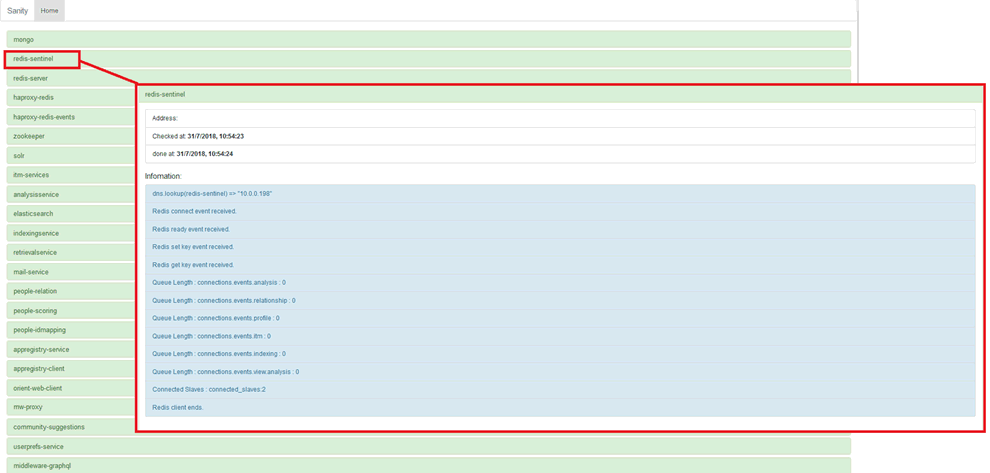
- Validates that a client can connect to Redis through both HAProxy and Redis Sentinel, and that the client can perform some basic Redis Operations (for example, get key and set key)
- Validates that a client can connect to MongoDB
- Validates that a client can connect to Zookeeper
- Validates that a client can connect to SOLR and retrieve a solr collection
Sanity will not validate the following capabilities in Component Pack:
- Functionality
- UI
- Performance
- Load testing of Component Pack
- Alerting
- Notifications on failures
Opening the Sanity dashboard
If you have installed the Ingress Controller, you can access the sanity dashboard with the following URL: http://master_node:32080/sanity/
For high availability deployments, replace master_node with the load balancer DNS of the HA cluster (must use a hostname and not IP).
If you do not have the Ingress Controller installed, you can still access the dashboard by:
- Determine the Sanity URL by running the following commands on the kubernetes
master:
export NODE_PORT=$(kubectl get --namespace connections -o jsonpath="{.spec.ports[0].nodePort}" services sanity) export NODE_IP=$(kubectl get nodes --namespace connections -o jsonpath="{.items[0].status.addresses[0].address}") echo http://$NODE_IP:$NODE_PORT - Browse to http://$NODE_IP:$NODE_PORT
The dashboard displays a tile for each service; click a tile to expand it and view details, as in
the following image: