Creating findings reports
About this task
After you scan, you may want to generate reports about the identified vulnerabilities. You can generate multiple findings reports:
- Findings
- Finding by Fix Groups
- Findings by Type
- Findings by Classification
- Findings by File
- Findings by API
- Findings by Bundle
- Findings by CWE (Common Weakness Enumeration)
- DTS Activity
Note: Findings reports show detailed findings by category, similar
to the results in the findings table. The generation of findings reports
can be memory-intensive (related to https://xmlgraphics.apache.org/fop/1.1/running.html#memory) and may require up to 1024 MB of additional
system memory. If you are generating a report for a scan of a large
application and noticing memory issues, you can scan parts of your
application separately or alter your scan configuration, and then
try to generate the report or reports again.
CWE ID hyperlinks in the findings report connect to the CWE website at http://cwe.mitre.org/.
To generate a findings report:
Procedure
- In a view that contains findings, select the findings to
include in the report. If you do not select any findings, the report
consists of all findings in the active view.
On the Tools menu, click Generate Findings Report. Alternatively, in views that contain findings, select and right-click a set of findings, and then select Generate Findings Report in the menu.
- In the Select Findings Report dialog
box, select a report type.Click Finish to generate the report - or click Next to specify these optional settings in the Specify Destination and Style Sheet page:
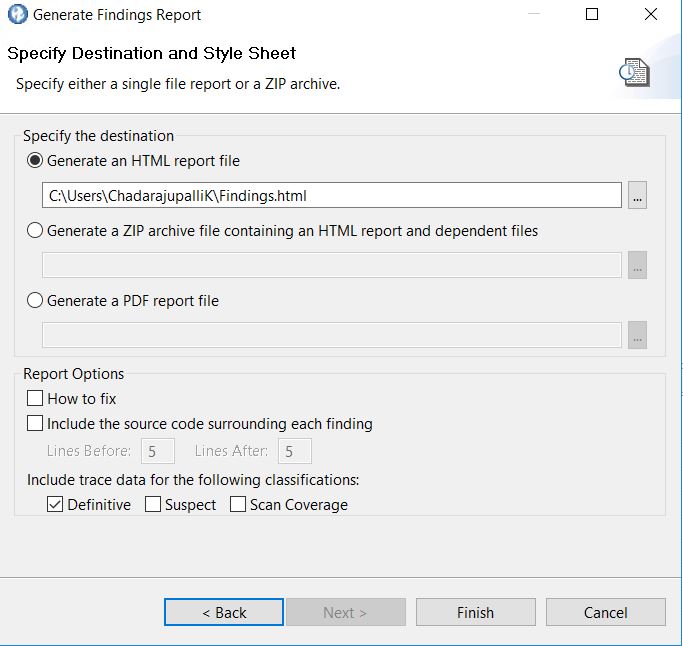
- You can specify the report destination and format. You can generate
the report in HTML format, as a ZIP file that contains all HTML report
components, or a PDF (you must have Adobe™ Acrobat
Reader to view PDF reports). If you do not specify a report destination
and format (or click Finish in the Select Findings
Report page), HTML is chosen by default, and the report is saved to <data_dir>\reports (where <data_dir> is the location of your
AppScan®
Source program data, as described in Installation and user data file locations).Note: If you are creating a custom report (rather than a findings report) in PDF format, you can specify the level of detail to include in the report:
- Summary: Contains counts for each report group
- Detailed: Contains counts for each API for each vulnerability property
- Comprehensive: Contains tables consisting of every finding for every API
- Annotated: Contains all findings and any notes, trace data, or code snippets included with the findings
- To include information in the report that suggest approaches to fixing issues, select How to fix.
- To include a code snippet in the report, select Include
the source code surrounding each finding and indicate
the number of lines before and after the vulnerable line of code to
include in the report.Tip: In the Reporting section of the Finding Detail view, you can also set the number of lines of code to include before and after the finding in reports.
After the report is generated, when you expand a finding that contains notes or code snippets, the source code appears below the finding in a blue box or below the yellow note. Bold red text highlights the vulnerable line of code.
- To include AppScan® Source trace data in the report, select one or more of the classifications (Definitive, Suspect, or Scan Coverage) under Include trace data for the following classifications.
Click Finish to generate the report.
- You can specify the report destination and format. You can generate
the report in HTML format, as a ZIP file that contains all HTML report
components, or a PDF (you must have Adobe™ Acrobat
Reader to view PDF reports). If you do not specify a report destination
and format (or click Finish in the Select Findings
Report page), HTML is chosen by default, and the report is saved to <data_dir>\reports (where <data_dir> is the location of your
AppScan®
Source program data, as described in Installation and user data file locations).