AppScan® Enterprise components
HCL® AppScan® Enterprise enables organizations to mitigate application security risk, strengthen application security program management initiatives and achieve regulatory compliance. Security and development teams can collaborate, establish policies and scale testing throughout the application lifecycle. Enterprise dashboards classify and prioritize application assets based on business impact and identify high-risk areas, permitting you to maximize your remediation efforts. Performance metrics are provided that help you monitor the progress of your application security programs.
This diagram depicts the AppScan® Enterprise ecosystem, including integrations.
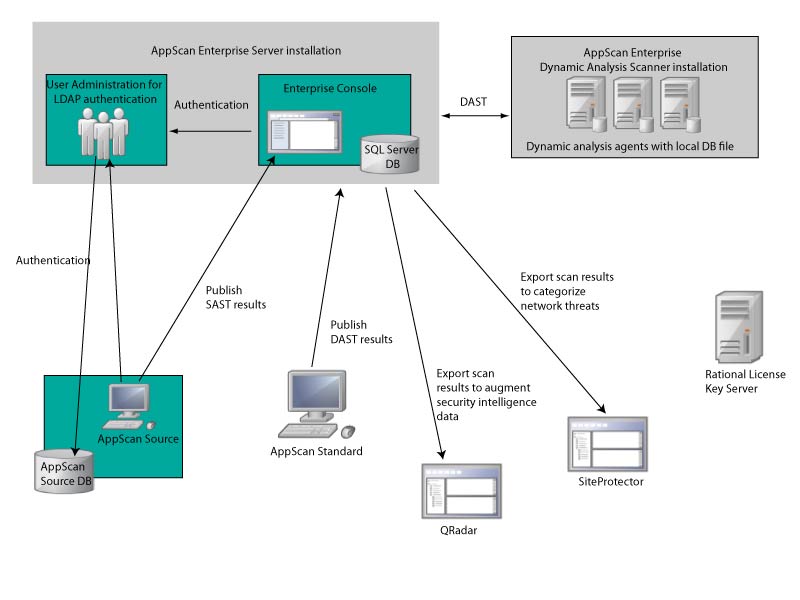
The SQL Server Database
The SQL Server database is the central repository for the following information gathered during a job: statistics, scan logs, polling for activity events, and is the means of communication between the Enterprise Console and the testing agents on the Dynamic Analysis Scanner. Regardless if you install the Server or Scanner, you create a database on a SQL Server you have installed in your environment. It should be configured first so that key information that AppScan® Enterprise Server requires during configuration is ready and available. The database contains the following data:
- All data gathered by the agents
- Information about the scope applied to report data
- Summarized historical reporting data
- Agent configuration, scheduling, status, and alerting information
- User configuration and permission information
AppScan® Enterprise Server
This component comprises:- User Administration: The User Administration component of the Enterprise Server is used
for LDAP user authentication. Note: If you are an AppScan® Source user, this is all you need to install, unless you want to see correlated reports from results you publish to the Enterprise Server. Then you need to install the Enterprise Console as well.
- Enterprise Console: The Enterprise Console provides the user interface and reports through a web browser. It is the main user interface and supports administration, scan configuration, and reporting. Depending on your requirements, you can install one or several instances of the Enterprise Console on a single server.
The Monitor view displays only the applications that you have permission to access. The dashboard charts track various metrics and trends of the web applications that compose your portfolio.
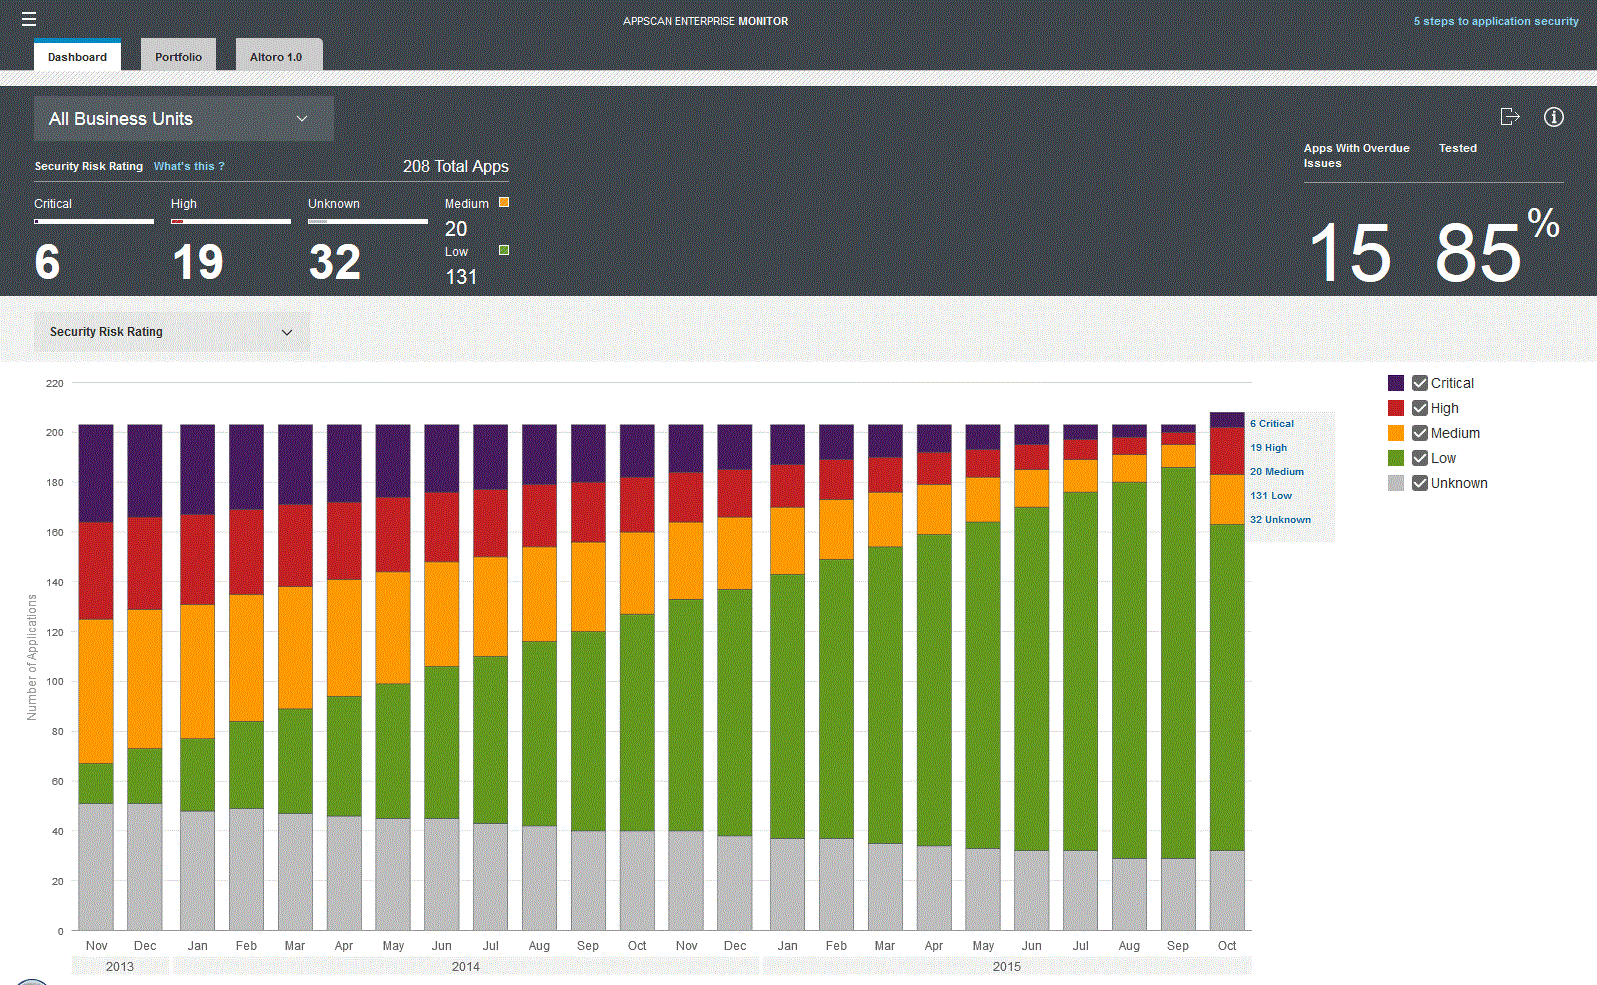
- Security Risk Rating (trend): Track application risk over time. Select the category check boxes to display the content you want to see. Hover over chart sections for details.
- Security Risk Rating by Business Unit: Prioritize application risk management by business unit. Hover over chart sections for details. Click through to the Portfolio tab to continue your triage process.
- Testing Status (trend): Track testing status. Select the category check boxes to display the content you want to see. Hover over chart sections for details.
- Open Issues (trend): Shows the number of open issues. Hover over chart sections for details.
- Applications with Open Issues (trend): Track the number of applications with open issues. Hover over chart sections for details.
- Top Issue Types: Shows the top issue types across all of your applications in the portfolio. For example, if there are many SQL injection issues, you can plan training for your developers. Hover over chart sections for details.
- Issue Severity (Max): Identifies applications by their highest level of issue severity. Hover over chart sections for details. Click through to the Portfolio tab to continue your triage process.
- Issue Severity (Max) by Business Unit: Identifies applications by business unit, by their highest level of issue severity. Hover over chart sections for details. Click through to the Portfolio tab to continue your triage process.
Dynamic Analysis Scanner
- Agent service and agents: The agent service monitors the SQL Server database for jobs to
perform. An agent is a Windows™ process that is created by an agent service when there is a job to
be performed. A local database file is created at the beginning of each scan. Having a local
database improves performance and scalability because it frees up the resource load on the central
SQL database. The local database holds the information for each job the Scanner runs and sends the
data to the main SQL Server database when the scan is completed. If alerts have been configured, the
alerting service informs the relevant users when specific events occur during the job.Note:
- Content and infrastructure agents can perform only one job at a time; however, a single Scanner can run more than one agent simultaneously. More than one job of the same type can be executed simultaneously on a given computer, with each job being run in its own agent process.
- The number of jobs running can exceed the maximum number of agents assigned to the Scanner because the number of jobs running includes jobs that are now in postprocessing or report generation. These jobs are no longer using an agent on the Scanner.
- If the number of blackout period suspended jobs exceeds the available number of available agents on the Scanner, the blackout period suspended job is given priority when it is time to run the next job.
- Alerting service: The alerting service is responsible for sending alerts to the appropriate notification devices. Although you can have as many agents and agent services as you need, only one alerting service can be installed for each database.